
HRV Applications for Optimal Performance
Optimal performance requires optimal nervous system responsiveness to demands and the capacity to return to a resting state for optimal recovery. Graphic © ESB Professional/Shutterstock.com.

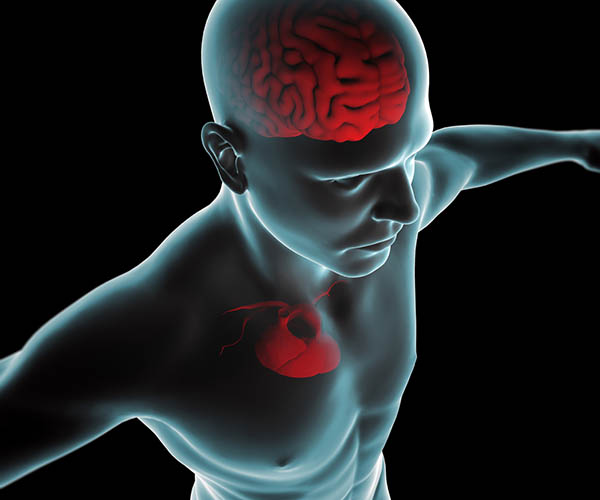
Neural activity from the heart travels to the brain via the autonomic nervous system. The ascending vagus nerve influences the brain centers associated with thinking, decision-making, reaction times, long- and short-term memory, and self-regulation (Shaffer, McCraty, & Zerr, 2014). Graphic © Naeblys/ Shutterstock.com.
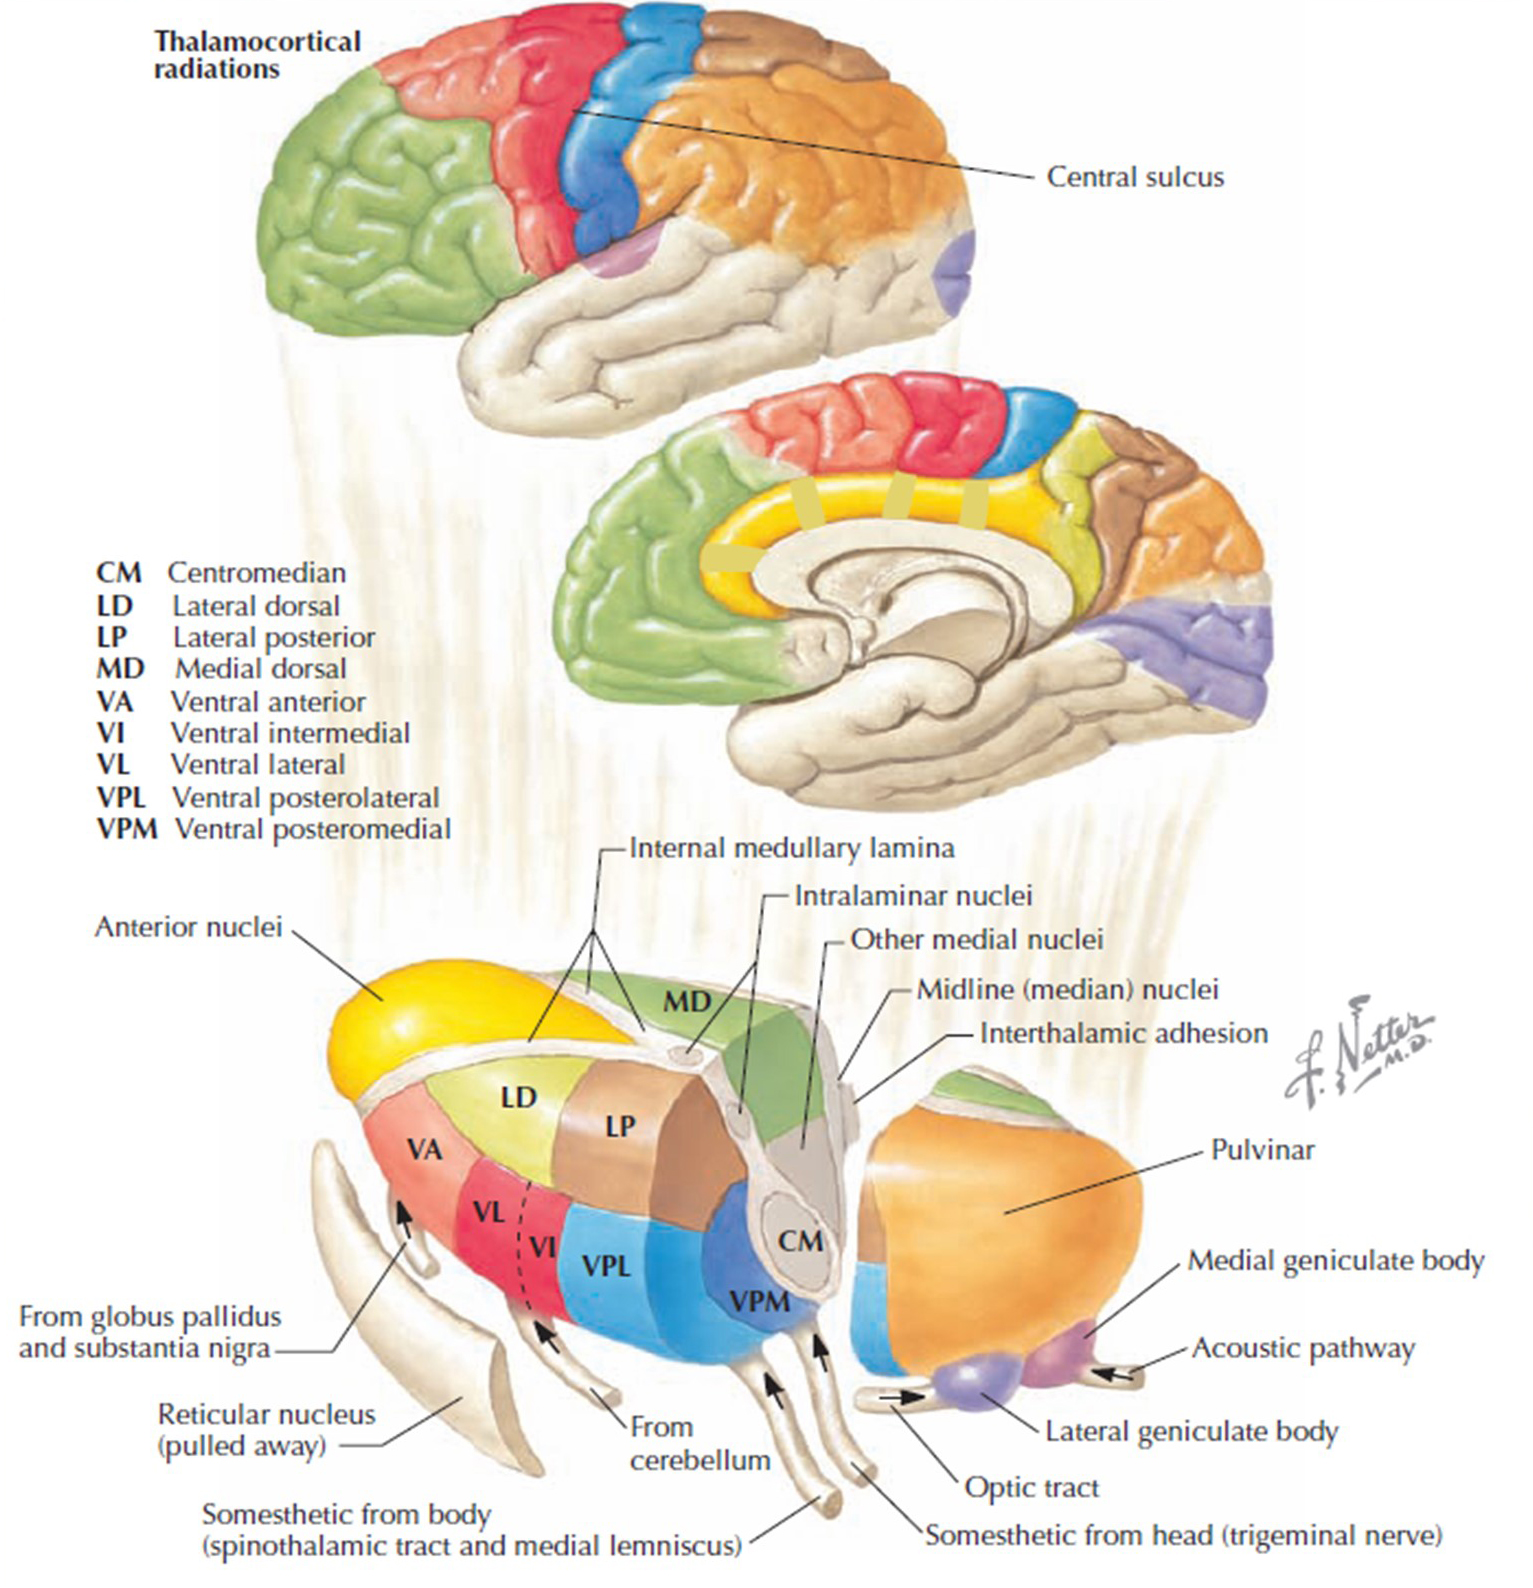
The thalamus is involved in essential brain functions and is affected by the neural signals from the heart. One of its many roles is synchronizing the entire brain's neural activity, including executive functions. The diagram shows connections between the pulvinar (bottom right), the thalamus' reticular nuclei (bottom left), and the cortex © Elsevier Inc. - Netterimages.com.
BCIA Blueprint Coverage
This unit addresses X. HRV Optimal Performance Protocols. This unit covers Performance Attributes in HRV, Culture and Goals of HRV in Performance, Evolution of HRV Protocols for Optimal Performance, Introduction to HRV Training, Remote & Home-Use Performance Training, Monitoring Training, Measuring Progress, and Generalization to Field/Duty Performance, and Full HRV Session Demonstrations.
A. PERFORMANCE ATTRIBUTES IN HRV

This section covers Performance Attributes in HRV, including Focus and Attention, Stress and Anxiety, and Mood and Attitude.
Focus and Attention
Optimal performance is more than excellent physical conditioning. The disciplined or trained capacity for heightened attention is essential to achieving optimal performance. HRV values are correlated with attentional capacity. Lower time-domain (e.g., RMSSD) and frequency-domain (e.g., HRV power) are correlated with inattention, higher anxiety, and diminished emotional regulation (Griffiths et al., 2017; Hsieh et al., 2010).We will next examine the role of the locus coeruleus and anterior cingulate cortex in focus and attention.
Locus Coeruleus (LC)
The locus coeruleus (LC) is a small group of neurons that project from the brainstem to the thalamus, limbic system, and cerebral cortex. These neurons are an important sympathetic nervous system component (Mather et al., 2017). The locus coeruleus pathway contributes to wakefulness and vigilance for salient stimuli. These neurons are the main source of synaptically-released norepinephrine, which is an excitatory catecholamine at many receptors.When we are inattentive, thalamic pacemakers generate the alpha rhythm. When we need to focus attention, we activate the brainstem noradrenergic locus coeruleus. The increased release of norepinephrine by this 15-millimeter network focuses attention and abolishes alpha oscillations. The locus coeruleus enhances the brain's sensory information processing by suppressing thalamic alpha generators. This may be an underlying mechanism of the phenomenon of alpha blocking.
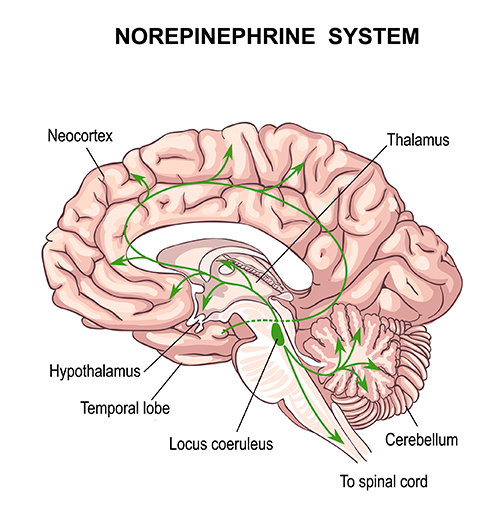
The locus coeruleus system plays a crucial role in optimal performance. The locus coeruleus enhances attention, sensory processing (thalamus), motor performance (motor cortex), and working memory (prefrontal cortex; Siennicka et al., 2019).
The nervous system metabolizes norepinephrine into neuromelanin, which is stored in the locus coeruleus. A contrast MRI of the locus coeruleus can measure neuromelanin accumulation, which can serve as a biomarker of chronic activation.
Higher locus coeruleus MRI contrast is associated with lower parasympathetic influence over heart rate variability. The locus coeruleus inhibits vagal neurons from the heart, activating the sympathetic nervous system. Higher LC-MRI contrast was inversely related to high-frequency HRV power (Mather et al., 2017).
Anterior Cingulate Cortex (ACC)
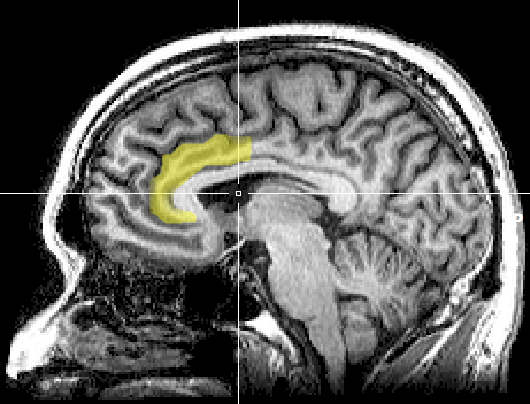
The anterior cingulate cortex (ACC) (Fpz, Fz, Cz, Pz) lies above the corpus callosum (BA 24, 32, 33). The dorsal ACC is connected to both the PFC and parietal cortex. The ACC plays a vital role in attention and is activated during working memory. The ACC mediates emotional and physical pain, and has cognitive (dorsal anterior cingulate) and affective (ventral anterior cingulate) conflict-monitoring components. ACC graphic courtesy of Geoff B. Hall in Wikimedia Commons.
A functional MRI (fMRI) showed increased task-related ACC activation. Stimulus congruence occurs when two stimuli share an expected relationship. For example, the word "LEFT" appears on a screen to the left of the fixation point. Stimulation incongruence exists when the expected relationship is violated. For example, the word "LEFT" is displayed to the right, or in a Stroop Test, the word "ORANGE" is shown in blue.
Dorsal ACC activation is higher in incongruent than congruent trials, probably because of the greater cognitive load. Faster task speeds during incongruent trials activate the ventral ACC (vACC), reflecting increased processing demands.
High-frequency (HF) power is associated with left vACC activation in congruent and incongruent trials. vACC activation adjusts parasympathetic nervous system (PNS) tone, which is seen in changes in HF power. ACC functioning during a cognitive challenge task is closely linked to HRV modulation. Therefore, the ACC mediates more than conflict or error detection. It also exerts top-down control of the internal milieu via autonomic nervous system regulation (Critchley et al., 2003; Forte et al., 2019).
Stress and Anxiety
Optimal performance is more than excellent physical conditioning and focused attention.Anxiety Control and Stress Tolerance
Stress tolerance or coping with high-stress conditions while maintaining optimal cognitive functions is also very important to optimal or peak performance athletes. Research participants able to perform exceptionally well on cognitive tasks, independent of the induced high-stress condition (e.g., the threat of shock), showed higher HF spectral power than those who performed poorly on these tasks. Training individuals to master higher HRV under stress conditions is correlated with improved cognitive performance under such conditions (Hansen et al., 2009). Graphic © Maridav/Shutterstock.com.
Compared to healthy controls, individuals with anxiety conditions like PTSD show dominant very-low-frequency (VLF) and decreased HF power consistent with SNS arousal and reduced PNS activity (e.g., vagal withdrawal). The graphic below shows VLF power in red and HF power in blue.
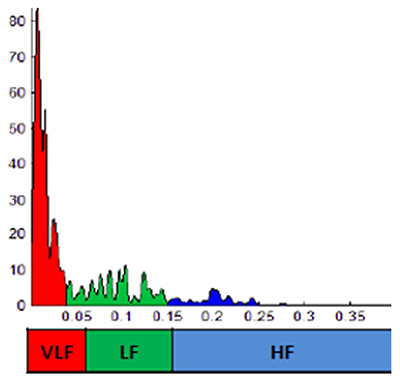
Likewise, those diagnosed with stress-related conditions have lower time-domain measures (e.g., RMSSD, SDNN) than healthy controls (Cohen & Benjamin, 2006; Forte et al., 2021; Kim et al., 2018; Schneider & Schwerdtfeger, 2020).
When exposed to stressors, those with anxiety conditions have elevated resting heart rates observed during SNS activation. Faster heart rates reduce the time between successive beats and the opportunity for interbeat intervals (IBIs) to vary.
Mood and Attitude
Greater HF power correlates with reduced depression severity. Individuals with prior depression and dysphoric mood have lower time-domain (e.g., SDNN) and HF power. HRV is a promising predictor of depression risk. Not only do HRV values predict and correlate with depression and depression severity, but a meta-analysis demonstrated that HRV biofeedback improves depressive symptoms. The authors argued that HRV biofeedback should be considered a valid intervention to improve mood, social interactions, and general wellbeing (Dar et al., 2016; Dell'Acqua et al., 2020; Hartmann et al., 2019; Pizzoli et al., 2021). Graphic © PKPix/Shutterstock.com.
B. CULTURE AND GOALS OF HRV IN PERFORMANCE
Performance goals vary with the performer and the athletic or non-athletic demand where excellence is required. Setting physiological performance goals may include motor speed, but motor speed without errors. Continuous performance tasks measure omission and commission errors for this reason.
Speed may be secondary to accuracy. Attention that is highly focused to the point of tunnel vision may be less important than more open awareness of the viewer's periphery.
HRV values can be useful in monitoring the nervous system of an athlete or operator under demand conditions. HRV biofeedback can be instrumental in the pre-training and performance work-ups so that autonomic and central nervous system flexibility is improved.
HRV measures support optimal physical training by helping to identify the early signs of overtraining and even selecting the best times of day and training duration. HRV measures are best tracked by selecting similar times of the day and with paced breathing controls in place.
HRV measures recorded at daily or weekly intervals can give the athlete and coach a window into health trends that may signal early interventions to avoid injury or mood-related declines.
C. EVOLUTION OF HRV PROTOCOLS FOR OPTIMAL PERFORMANCE
Early Protocols
Early protocols were based on published studies (e.g., resonance frequency training; Lehrer et al., 2013). Athletes use HRV measures to quantify and monitor cardiac modulation of the SNS and PNS components of the ANS. This is principally to track training adaptations to maximize training without inadvertently hindering performance by overtraining. Lower time-domain (e.g., RMSSD, SDNN) and frequency-domain (e.g., total, LF, and HF power) values can signal overtraining.HRV measures are utilized to select optimal training intensity, duration, and rest periods. HRV metrics can signal when an athlete achieves maximum recovery between workouts (Dong, 2016).
Selecting a Training Protocol Model
Performance professionals can choose among several evidence-based HRV training protocols. These include 0.1 Hz or resonance frequency training using paced breathing or rhythmic skeletal muscle tension (RSMT).0.1 Hz training involves paced breathing or RSMT six times per minute. This is a "one size fits all" protocol that is not optimized for individual differences. However, it does not require time-consuming resonance frequency measurement.
In contrast, resonance frequency training is individualized to athletes when teaching paced breathing or muscle contraction. Some will find optimal LF power at 5.5, while others at 6.0 breaths per minute. Professionals quantify pre- and post-training ANS changes using time-domain (e.g., RMSSD, SDNN) and frequency-domain (e.g., HF power) when athletes breathe at normal rates.
D. INTRODUCTION TO HRV TRAINING
Applications
Major performance HRV applications include anxiety, depression, and over-arousal. Lehrer and colleagues' (2020) systematic review found that HRV biofeedback produced the largest effect sizes for anxiety, depression, and athletic performance.
Indicators for Using Paced Breathing and/or RSMT Protocols
Paced breathing is a good place to start since most software allows the user to select breath pacers. Adults often start with 6.0 breathing rates. This means one full inhalation and exhalation cycle every 10 seconds, or six breath cycles per minute. Typically, the exhalation is a second longer than the inhalation. Although there are several variations, a 4-second inhalation followed by a brief pause and a 5-second exhalation permits a 10-second breath cycle.Athletes need to be aware of diaphragmatic muscle use while minimizing the recruitment of upper chest muscles. Some call this abdominal or belly breathing. Athletes should expect that greater use of new muscles like the diaphragm may cause them to fatigue. They should anticipate feeling light-headed and take a break to reverse this. They should be prepared to take a break if they experience paradoxical anxiety as autonomic balance shifts to a new and healthier pattern.
Some home-use devices permit athletes to try different pacing rates and select the one that yields the greatest LF power. This allows individualizing the pacing rate for daily training.
Although not typical for healthy athletes, respiratory muscle strength training (RSMT) may improve diaphragmatic paced breathing following injury or other medical conditions. Musicians and vocalists often use portable devices to improve inspiratory and expiratory muscle function. Conceivably, these exercises might help long-distance tactical marksmen.
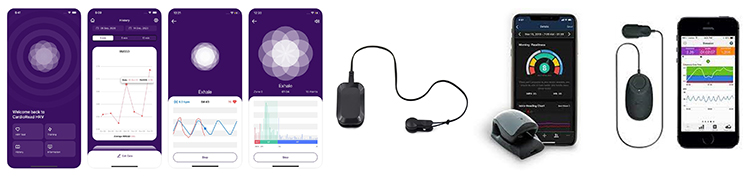
E. REMOTE AND HOME-USE PERFORMANCE TRAINING
Ideally, individualized breath pace determination to optimize HRV power utilizes respiratory and pulse (ECG or BVP) sensors. This permits coaching on using the diaphragm, discussions about feeling light-headed, paradoxical anxiety management, and education regarding the meaning of time- and frequency-domain values common to most HRV devices and software.
There are many low-cost personal-use HRV assessment and biofeedback devices on the market. Athletes can export text files for post-analysis (e.g., Kubios) to validate the measurements provided by different devices and track time-domain (e.g., RMSSD, SDNN) and frequency-domain (e.g., LF power) metrics. Training periods as short as 5 minutes can be helpful, while 10-20 minutes are optimal.
F. MONITORING TRAINING, MEASURING PROGRESS, AND GENERALIZATION TO FIELD/DUTY PERFORMANCE
Training environments that closely mimic field or duty performance result in optimal performance where it counts. A key component is training to focus attention. Heart rate variability pre-training can contribute to this goal. The coordination of the heart and brain is essential for achieving focused training that leads to optimal field performance.
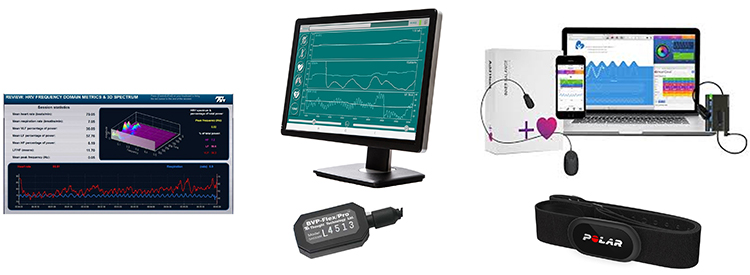
G. FULL HRV SESSION DEMONSTRATIONS
Several HRV equipment and software options utilize apps, tablet, and personal computers. In many cases, text file data can be exported from the device software to additional analysis software (e.g., Kubios).
Dr. Inna Khazan demonstrates how paced and normal breathing can change low- and high-frequency power © Association for Applied Psychophysiology and Biofeedback. You can enlarge the video by clicking on the bracket icon at the bottom right of the screen. When finished, click on the ESC key.
In the video below, Dr. Hagedorn shows a sample HRV biofeedback training session using a PPG sensor with respiration. Video used with permission.
Female Power Lifter

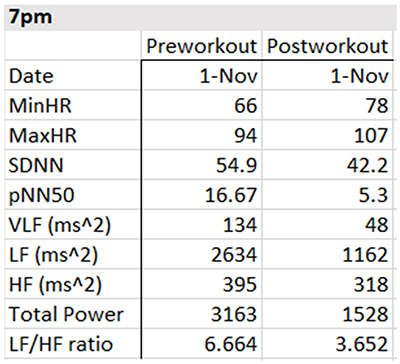
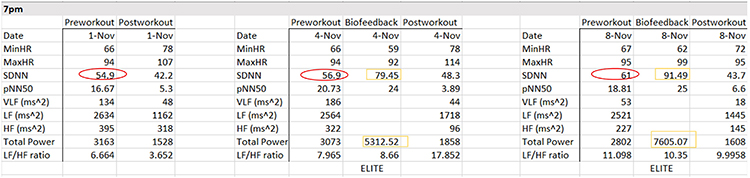
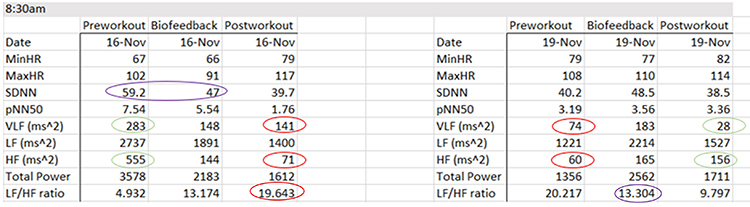
The table below summarizes HRV pre-workout, biofeedback, and post-workout data collected on November 1, 4, and 8 at 7 pm and November 17 and 19 at 8:30 am. She breathed at normal rates and did not receive feedback during the pre-workout and post-workout periods.
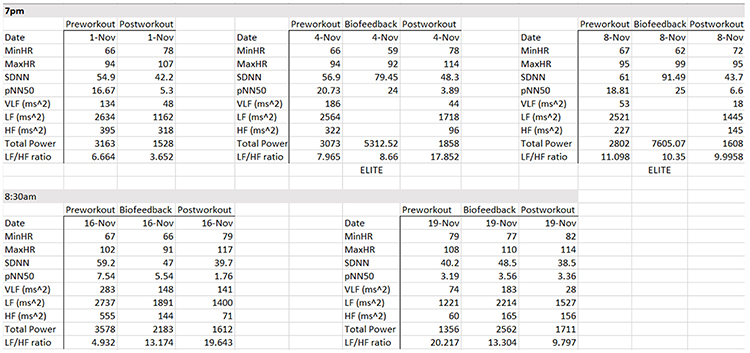
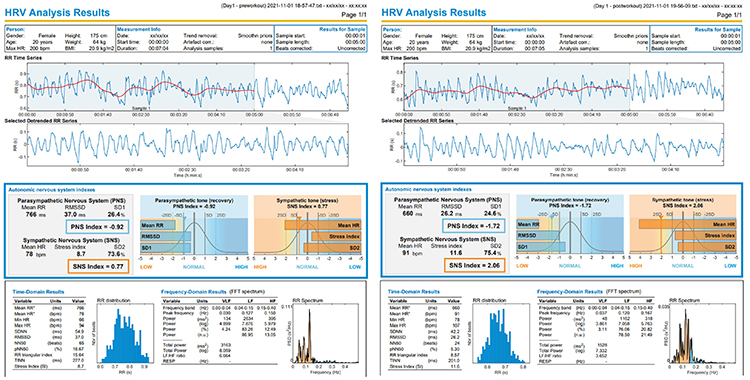
Focusing on the November 1 training session, the pre-workout data show resting parasympathetic dominance, low pNN50 and SDNN, and good total power. The post-workout data reveal three signs of fatigue: LF/HF, total power, and SDNN declines.
The evening data from November 1, 4, and 8 show three signs of progress: progressive increases in pre-workout SDNN, greater SDNN and total power after HRV biofeedback training, and the maintenance of PNS dominance during the baseline.
There are anomalies in the November 16 morning data. For example, on November 16, SDNN declined from pre-workout to HRV biofeedback training. HF power plunges from pre-workout to post-workout.
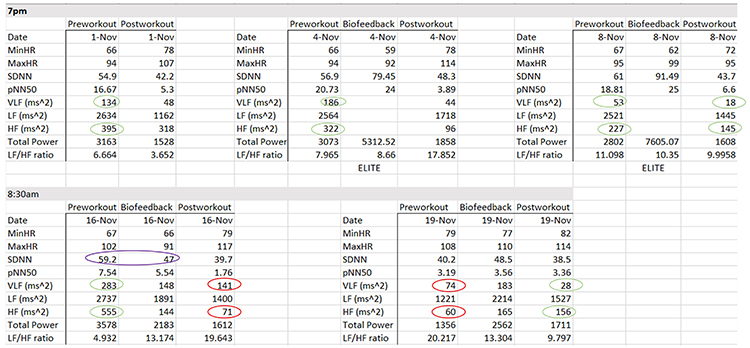
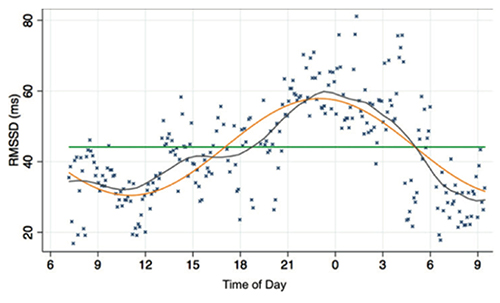
Why the anomalies? We always have to consider the effect of the circadian rhythm on HRV. The metrics tend to improve as the day progresses (Vitale et al., 2019).
The workout context provides another explanation for the morning data anomalies. The workout consisted of deadlifts and leg press, where she achieved a new maximum of 658 pounds. The abnormal physical stress activated her SNS. Three days later, we can see low SDNN and total power, and HF power < VLF power. The absence of rest days placed her on the verge of over-training.
At the same time, HRV biofeedback produced positive changes in SDNN (48.5 vs. 40.2 ms) and a decreased LF/HF ratio (13.3 vs. 20.2).
We recommend exporting the raw interbeat interval data into programs like Kubios for more complete statistical and graphical comparison of pre- and post-workout HRV.
Glossary
0.1 Hz biofeedback: training to concentrate ECG power around 0.1 Hz in the low frequency (LF) band by teaching patients to breathe diaphragmatically at their RF around 6 breaths per minute and to experience positive emotional tone to maximize heart rate variability.
cycle length dependence: the phenomenon where faster HRs reduce the time between successive beats and the opportunity for the interbeat intervals (IBIs) to vary, resulting in lower HRV.
epinephrine (E): an adrenal medullary hormone that increases muscle blood flow, converts stored nutrients into glucose for use by skeletal muscles, and initiates cardiac muscle contraction when it binds to β1 receptors.
frequency-domain measures of HRV: the absolute or relative power of the HRV signal within four frequency bands.
heart rate: the number of heartbeats per minute, also called stroke rate.
heart rate variability (HRV): the beat-to-beat changes in HR involving changes in the RR intervals between consecutive heartbeats.
high-frequency (HF) band: ECG frequency range from 0.15-0.40 Hz that represents the inhibition and activation of the vagus nerve by breathing (RSA).
interbeat interval (IBI): the time interval between the peaks of successive R-spikes (initial upward deflections in the QRS complex). This is also called the NN (normal-to-normal) interval after removing artifacts.
locus coeruleus: the noradrenergic branch of the ascending reticular activating system, which is responsible for vigilance. Subnormal norepinephrine transmission may contribute to ADHD.
low-frequency (LF) band: an ECG frequency range of 0.04-0.15 Hz that may represent the influence of PNS, SNS, and baroreflex activity (when breathing at the RF).
norepinephrine: a monoamine neurotransmitter that exerts postsynaptic effects at alpha and beta receptors, each with two subtypes. All norepinephrine receptors are G protein-linked. The cell bodies of the core noradrenergic system are located in the locus coeruleus, a nucleus found in the dorsal pons.
pNN50: the percentage of adjacent NN intervals that differ from each other by more than 50 milliseconds.
resonance frequency: the frequency at which a system, like the cardiovascular system, can be activated or stimulated.
respiratory sinus arrhythmia (RSA): the respiration-driven heart rhythm that contributes to the high frequency (HF) component of heart rate variability. Inhalation inhibits vagal nerve slowing of the heart (increasing HR), while exhalation restores vagal slowing (decreasing HR).
resting baseline: breathing at typical rates without pacing or feedback.
RMSSD: the square root of the mean squared difference of adjacent NN intervals.
SDNN: the standard deviation of the normal (NN) sinus-initiated IBI measured in milliseconds.
spectral analysis: the division of heart rate variability into its component rhythms that operate within different frequency bands.
time-domain measures of HRV: indices like SDNN that measure the degree to which the IBIs between successive heartbeats vary.
ultra-low-frequency (ULF) band: an ECG frequency range below 0.003 Hz. Very slow biological processes that include circadian rhythms, core body temperature, metabolism, and the renin-angiotensin system, and possibly the PNS and SNS, generate ULF activity.
vagus nerve: the parasympathetic vagus (X) nerve decreases the rate of spontaneous depolarization in the SA and AV nodes and slows HR. Heart rate increases often reflect reduced vagal inhibition.
very-low-frequency (VLF): an ECG frequency range of 0.003-.04 Hz that may represent temperature regulation, plasma renin fluctuations, endothelial, physical activity influences, possible intrinsic cardiac nervous system, PNS, and SNS contributions.
Test Yourself
Customers enrolled on the ClassMarker platform should click on its logo to take 10-question tests over this unit (no exam password).

Appreciation
Dr. David Hagedorn generously contributed to the development of this unit. This content is used with permission.
References
Agelink, M., Boz, C., Ullrich, H., & Andrich, J. (2002). Relationship between major depression and heart rate variability. Clinical consequences and implications for antidepressive treatment. Psychiatry Research, 113(1), 139-149. https://doi.org/10.1016/s0165-1781(02)00225-1
Akselrod, S., Gordon, D., Ubel, F. A., Shannon, D. C., Berger, A. C., & Cohen, R. J. (1981). Power spectrum analysis of heart rate fluctuation: A quantitative probe of beat-to-beat cardiovascular control. Science, 213, 220-222. https://doi.org/10.1126/science.6166045
Berntson, G. G., Bigger, J. T., Eckberg, D. L., Grossman, P., Kaufmann, P. G., Malik, M., Nagaraja, H. N., Porges, S. W., Saul, J. P., Stone, P. H., & van der Molen, M. W. (1997). Heart rate variability: Origins, methods, and interpretive caveats. Psychophysiology, 34(6), 623-648. https://doi.org/10.1111/j.1469-8986.1997.tb02140.x
Berntson, G. G., Quigley, K. S., & Lozano, D. (2007). Cardiovascular psychophysiology. In J. T. Cacioppo, L. G. Tassinary, & G. G. Berntson (Eds.). Handbook of psychophysiology (3rd ed.). Cambridge University Press.
Cohen, H., & Benjamin, J. (2006). Power spectrum analysis and cardiovascular morbidity in anxiety disorders. Auton Neurosci., 128(1-2), 1-8. https://doi.org/10.1016/j.autneu.2005.06.007. PMID: 16731048.
Critchley, H. D., Mathias, C. J., Josephs, O., O’Doherty, J., Zanini, S., Dewar, B.-K., Cipolotti, L., Shallice, T., & Dolan, R. J. (2003). Human cingulate cortex and autonomic control: Converging neuroimaging and clinical evidence. Brain, 126(10),2139–2152. https://doi.org/10.1093/brain/awg216
Dahr, A. K., Lambert, G. W., & Barton, D. A. (2016). Depression and cardiovascular disease: Psychobiological mechanisms. In M. E. Alvarenga, & D. Byrne (Eds.). Handbook of psychocardiology. Springer Singapore.
Dell'Acqua, C., Dal Bò, E., Benvenuti, S. M., & Palomba, D. (2020). Reduced heart rate variability is associated with vulnerability to depression. Journal of Affective Disorders Reports, 1, 100006. https://doi.org/10.1016/j.jadr.2020.100006
Dong J. G. (2016). The role of heart rate variability in sports physiology. Experimental and Therapeutic Medicine, 11(5), 1531–1536. https://doi.org/10.3892/etm.2016.3104
Forte, G., Favieri, F., & Casagrande, M. (2019). Heart rate variability and cognitive function: A systematic review. Frontiers in Neuroscience, 13, 710. https://doi.org/10.3389/fnins.2019.00710
Griffiths, K. R., Quintana, D. S., Hermens, D. F., Spooner, C., Tsang, T. W., Clarke, S., & Kohn, M. R. (2017). Sustained attention and heart rate variability in children and adolescents with ADHD. Biological psychology, 124, 11–20. https://doi.org/10.1016/j.biopsycho.2017.01.004
Hansen, A. L., Johnsen, B. H., & Thayer, J. F. (2009). Relationship between heart rate variability and cognitive function during threat of shock. Anxiety, Stress, and Coping, 22(1), 77–89. https://doi.org/10.1080/10615800802272251
Hartmann, R., Schmidt, F. M., Sander, C., & Hegerl, U. (2019). Heart rate variability as indicator of clinical state in depression. Frontiers in Psychiatry, 9, 735. https://doi.org/10.3389/fpsyt.2018.00735
Hsieh, T.-C., Huang, C.-J., & Hung, T.-M. (2010). Relationships between heart rate variability and athletic performance. International Journal of Sport and Exercise Psychology, 8(4), 473-475. https://doi.org/10.1080/1612197X.2010.9671964
Kim, H. G., Cheon, E. J., Bai, D. S., Lee, Y. H., & Koo, B. H. (2018). Stress and Heart rate variability: A meta-analysis and review of the literature. Psychiatry Investigation, 15(3), 235–245. https://doi.org/10.30773/pi.2017.08.17
Lehrer, P. M. (2013). How does heart rate variability biofeedback work? Resonance, the baroreflex, and other mechanisms. Biofeedback, 41(1), 26-31. https://doi.org/10.5298/1081-5937-41.1.02
Lehrer, P. M., Kaur, K., Sharma, A., Shah, K., Huseby, R., Bhavsar, J., & Zhang, Y. (2020). Heart rate variability biofeedback improves emotional and physical health performance: A systematic review and meta analysis. Applied Psychophysiology and Biofeedback, 45,109-129. https://doi.org/10.1007/s10484-020-09466-z
Lehrer, P., Vaschillo, B., Zucker, T., Graves, J., Katsamanis, M., Aviles, M., & Wamboldt, F. (2013). Protocol for heart rate variability biofeedback training. Biofeedback, 41(3), 98-109.
Mather, M., Joo Yoo, H., Clewett, D. V., Lee, T. H., Greening, S. G., Ponzio, A., Min, J., & Thayer, J. F. (2017). Higher locus coeruleus MRI contrast is associated with lower parasympathetic influence over heart rate variability. NeuroImage, 150, 329–335. https://doi.org/10.1016/j.neuroimage.2017.02.025
Nunan, D., Sandercock, G. R. H., & Brodie, D. A. (2010). A quantitative systematic review of normal values for short-term heart rate variability in healthy adults. Pacing and Clinical Electrophysiology, 33(11), 1407-1417. https://doi.org/10.1111/j.1540-8159.2010.02841.x
Ogletree-Hughes, M. L., Stull, L. B., Sweet, W. E., Smedira, N. G., McCarthy, P. M., & Moravec, C. S. (2001). Mechanical unloading restores beta-adrenergic responsiveness and reverses receptor down-regulation in the failing human heart. Circulation, 104, 881-886. https://doi.org/10.1161/hc3301.094911
Opthof, T. (2000). The normal range and determinants of the intrinsic heart rate in man. Cardiovascular Research, 45, 177-184. PMID: 10728332
Papillo, J. F., & Shapiro, D. (1990). The cardiovascular system. In J. T. Cacioppo & L. G. Tassinary (Eds.) Principles of psychophysiology: Physical, social, and inferential elements (pp. 456 - 512). Cambridge University Press.
Pizzoli, S. F. M., Marzorati, C., Gatti, D., Monzani, D., Mazzocco, K., & Pravettoni, G. (2021). A meta-analysis on heart rate variability biofeedback and depressive symptoms. Sci Rep, 11, 6650. https://doi.org/10.1038/s41598-021-86149-7
Schneider, M., & Schwerdtfeger, A. (2020). Autonomic dysfunction in posttraumatic stress disorder indexed by heart rate variability: A meta-analysis. Psychological Medicine, 50(12), 1937–1948. https://doi.org/10.1017/S003329172000207X
Shaffer, F., McCraty, R., & Zerr, C. L. (2014). A healthy heart is not a metronome: An integrative review of the heart’s anatomy and heart rate variability. Frontiers in Psychology. doi:10.3389/fpsyg.2014.01040
Siennicka, A., Quintana, D. S., Fedurek, P., Wijata, A., Paleczny, B., Ponikowska, B., & Danel, D. P. (2019). Resting heart rate variability, attention and attention maintenance in young adults. International Journal of Psychophysiology: Official Journal of the International Organization of Psychophysiology, 143, 126–131. https://doi.org/10.1016/j.ijpsycho.2019.06.017
Stauss, H. M. (2003). Heart rate variability. Am J Physiol Regul Integr Comp Physiol, 285, R927-R931. https://doi.org/10.1152/ajpregu.00452.2003
Task Force of the European Society of Cardiology and the North American Society of Pacing and Electrophysiology (1996). Heart rate variability: Standards of measurement, physiological interpretation, and clinical use. Circulation, 93, 1043-1065. PMID: 8598068
Taylor, J. A., Carr, D. L., Myers, C. W., & Eckberg, D. L. (1998). Mechanisms underlying very-low-frequency RR-interval oscillations in humans. Circulation, 98, 547-555. https://doi.org/10.1161/01.cir.98.6.547
Thayer, J. F., Ahs, F., Fredrikson, M., Sollers, J. J., & Wager, T. D. (2012). A meta-analysis of heart rate variability and neuroimaging studies: Implications for heart rate variability as a marker of stress and health. Neuroscience and Biobehavioral Reviews, 36, 747-756. https://doi.org/10.1016/j.neubiorev.2011.11.009
Thayer, J. F., & Lane, R. D. (2000). A model of neurovisceral integration in emotion regulation and dysregulation. Journal of Affective Disorders, 61, 201-216. https://doi.org/10.1016/s0165-0327(00)00338-4
Umetani, K., Singer, D. H., McCraty, R., & Atkinson, M. (1998). Twenty-four hour time domain heart rate variability and heart rate: Relations to age and gender over nine decades. Journal of the American College of Cardiology, 31(2), 593-601. https://doi.org/10.1016/s0735-1097(97)00554-8
Vaillancourt, D. E., & Newell, K. M. (2002). Changing complexity in human behavior and physiology through aging and disease. Neurobiology of Aging, 23, 1-11. https://doi.org/10.1016/s0197-4580(01)00247-0
Vaschillo, E., Lehrer, P., Rishe, N., & Konstantinov, M. (2002). Heart rate variability biofeedback as a method for assessing baroreflex function: A preliminary study of resonance in the cardiovascular system. Applied Psychophysiology and Biofeedback, 27, 1-27. https://doi.org/10.1023/a:1014587304314
Vaschillo, E., Vaschillo, B., & Lehrer, P. (2004). Heartbeat synchronizes with respiratory rhythm only under specific circumstances. Chest, 126, 1385-1386. https://doi.org/10.1016/S0012-3692(15)31329-5
Vaschillo, E. G., Vaschillo, B., Pandina, R. J., & Bates, M. E. (2011). Resonances in the cardiovascular system caused by rhythmical muscle tension. Psychophysiology, 48, 927-936. https://doi.org/10.1111/j.1469-8986.2010.01156.x
Vitale, J. A., Bonato, M., La Torre, A., & Banfi, G. (2019). Heart rate variability in sport performance: Do time of day and chronotype play a role? Journal of Clinical Medicine, 8(5), 723. https://doi.org/10.3390/jcm8050723
Yasuma, F., & Hayano, J. (2004). Respiratory sinus arrhythmia: Why does the heartbeat synchronize with respiratory rhythm? Chest, 125(2), 683-690. https://doi.org/10.1378/chest.125.2.683